IDEA Note

  • 単回帰分析の傾きをPython(numpy)で求める

    単回帰分析の傾きをPython(numpy)で求める

    はじめに

    単回帰分析をする際、重要になるのが、「傾き」と「切片」。
    「切片」はセンタリングを行うことにより省略可能だが、「傾き」を計算するのは複雑な式を用いる。 難しそうなインパクトが強すぎて中身がまったく頭に入ってこない。 これをnumpyで実装する。
    実装

    準備

    まずは定数を定義

    # -*- coding: utf-8 -*-
    
    import numpy as np
    # ベクトルの定義
    # numpyでは([])で括る
    
    # 与えられたもの部屋の広さとか
    x = np.array([1,3,5,10,20])
    # その結果。値段など。
    y = np.array([2.5,6,11,21,38])
    
    # 全ての配列を表示
    print ("全ての配列を表示")
    print (x)
    print (y)

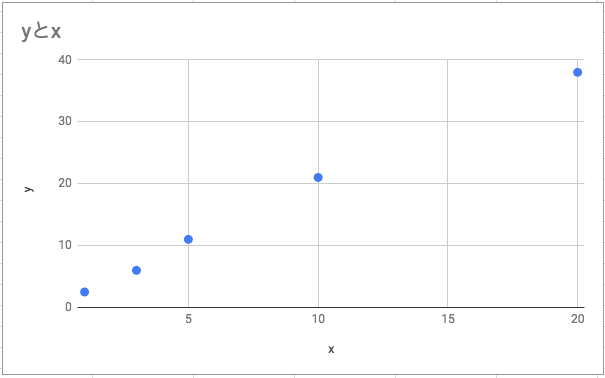
    描写するとこのような感じになる。 データの中心化を行う。値から、平均分を引く

    ## データの中心化
    # 平均の算出
    print x.mean()
    print y.mean()
    
    print ("中心化")
    # cはcenteringの略とする
    # pandsでも中心化する方法は存在する
    xc = x -x.mean()
    print (xc)
    
    yc = y - y.mean()
    print(yc)
    

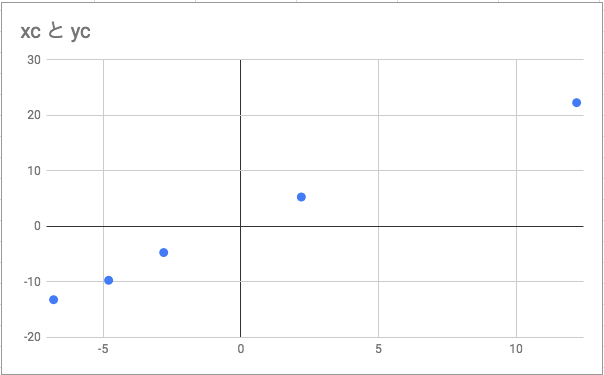
    描写するとこのような感じになる。
    グラフの形は変わらず、全体的に中心になった。  

    傾きを計算する

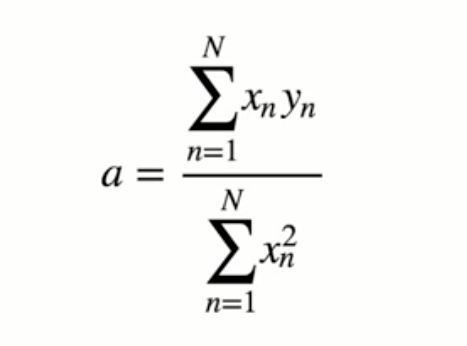
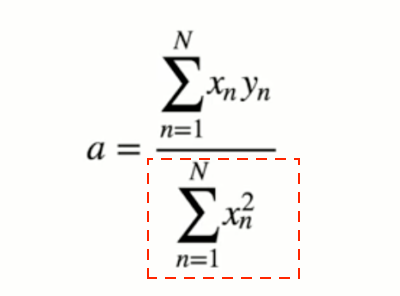
    改めて計算式を確認。
    分母、分子をそれぞれ別々に計算する。 numpyで計算する際は、このようになる

    # 分母はxc * xcで、最後に足す
    xcxc = xc * xc
    print xcxc
    print ("分母:")
    print xcxc.sum()

        次に分子

    xcyc = xc * yc
    print ("分子:")
    print xcyc.sum()
    

    最後に分子と分母を組み合わせる

    answer = xcyc.sum()/xcxc.sum()
    print ("傾き:")
    print (answer)


    実施結果

    $ python regression.py
    全ての配列を表示
    [1 2 3]
    [2.  3.9 6.1]
    2.0
    4.0
    中心化
    [-1.  0.  1.]
    [-2.  -0.1  2.1]
    パラメータaの計算
    [1. 0. 1.]
    分母:
    2.0
    分子:
    4.1
    傾き:
    2.05

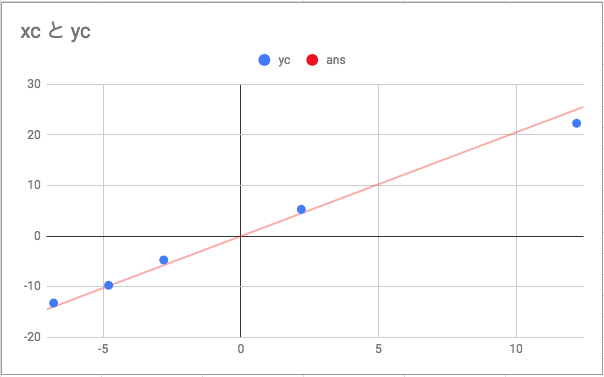
    傾きを元に実践を引いてみるとこのようになる 悪くなさそう。 実は実際はscikit-learnを使うともっと早いようだ。  
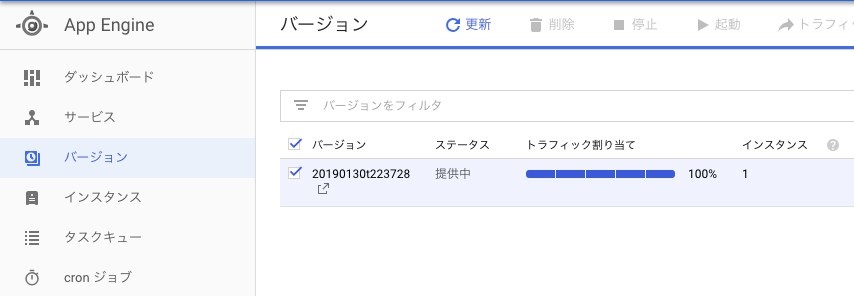
  • Google App Engineをコマンドで起動停止する

    Google App Engineをコマンドで起動停止する

    はじめに

    コマンドでGoogle App Engineを停止する。 
    前提条件としてgcloudコマンドがインストールされてあること。

    script

    #!/bin/bash
    set -eu
    
    env=$1
    method=$2
    
    # allocations ID取得
    ID=$(gcloud app services describe $1 | tail -n1 | awk '{print $1}' | sed "s/://g")
    echo $ID
    
    if [ $method == 'stop' ]; then
        gcloud app versions stop $ID -q
    elif [ $method == 'start'  ]; then
        gcloud app versions start $ID -q
    else
        echo ‘check your parameter’
    fi
    
    gcloud app versions list

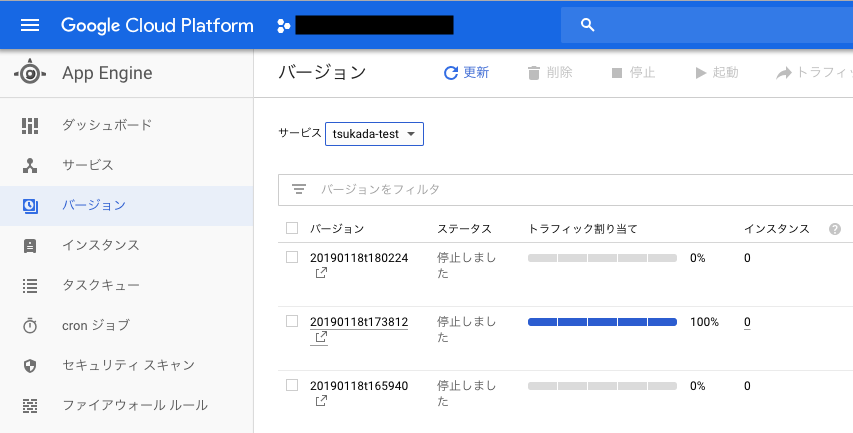
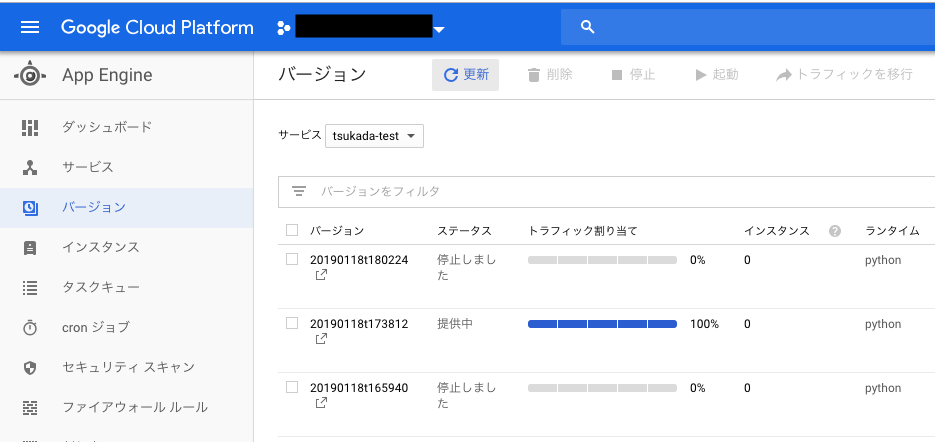
    引数にサービス名を加えて実行する “` ./script.sh tsukada-test stop “`   “` ./script.sh tsukada-test start “` 本来ならCloudFunctionで実装したかったが、大いにはまってしまったので、急遽この方法で対応した。  
    注意事項

    コマンドを見てもらえばわかる通り、versionの指定はあっても、serviceの指定がない。

    そのため、万が一 service は違うけど、動いているversionが同じ。と言う場合、意図しない方も影響を受けてしまう。

    実はオプションで “` –service “` が用意されている。

    https://cloud.google.com/sdk/gcloud/reference/app/versions/stop?hl=ja

    必要な場合はこのオプションを活用すればよい。


  • csvデータを簡単にグラフに描写する

    csvデータを簡単にグラフに描写する

    はじめに

    CSVファイルなどを手軽にグラフ化したいことがある。そんな時matplotlib.pyplotを使えば直ぐに簡易的なグラフに描写することができて便利だ csvの中身は以下のものとする

    a b
    10.5    22
    15.4    7.23
    11.8    7.1
    81.2    7.3
    15.1    13.4
    9.2 11.4
    

    実装方法

    import pandas as pd
    
    df = pd.read_table('~/Documents/sample.csv')
    a = df['a']
    b = df['b']
    
    import matplotlib.pyplot as plt
    plt.scatter(a,b)

    scatterが散布図を指定する事になる。

  • pandasでtab区切りのデータを読ませる

    pandasでtab区切りのデータを読ませる

    はじめに

    pandasでデータを読み込もうとした際、read_csvを使ったがタブが¥tとして読み込まれてしまい、期待通りの結果にならなかった ちなみに読み込んだデータはこちら

    $ cat ~/Documents/sample.csv 
    a   b
    10.5    22
    15.4    7.23
    11.8    7.1
    81.2    7.3
    15.1    13.4
    9.2 11.4

    原因

    pandasではcsvを読み込む処理と、tab区切りのデータを読み込ませる処理が明確に分かれている

    対処

    read_csvをread_tableに修正することで期待通りに読み込むことができた。 また、表示する件数を絞りたい場合はhead()を利用する 3を引数に渡すことで表示件数を3件に絞ることが可能になる。

  • S3でアクセス欄に「エラー」と表示される件を対処する

    S3でアクセス欄に「エラー」と表示される件を対処する

    はじめに

    AWSの権限周りは複雑に設定できるだけに難しい。今回の件もその一つ。アクセス欄が「エラー」になるのでその対処を行う。

    問題

    掲題のとおり。エラーになるのだ。

    対処

    ご察しの通りロールが足りないのが問題。

    実際どのロールかというと、以下のとおり。

    以下の設定はS3のディレクトリの確認や、権限まわりを表示させることができる

            {
                "Action": [
                    "s3:ListAllMyBuckets",
                    "s3:GetBucketPublicAccessBlock",
                    "s3:GetBucketPolicyStatus",
    
                    "s3:GetAccountPublicAccessBlock",
    
                    "s3:GetBucketAcl"                
                ],
                "Effect": "Allow",
                "Resource": "arn:aws:s3:::*"
            },

    この対処を行うと、エラーは解消される。


  • numpyで平均を求める

    numpyで平均を求める

    はじめに

    機械学習を勉強しているとPythonが避けて通れない。
    中でもnumpyはとても重要だったりする。

    基本的な使い方から調べた。

    使い方

    何はともあれinstall

    pipで一発。

    pip3 install numpy 

    import

    import numpy as np

    以降、npとして利用する

    変数に入れる

    x = np.array([1,2,3])
    

    1,2,3を配列として入れる

    結果は

    [1 2 3]

    変数の中の平均を取る

    この配列の中の平均を計算する
    一つ一つ足して、カラム数で割る・・・というような処理は不要で、

    .mean()メソッドを利用することで自動で計算することが可能。

    xaverage =x.mean()
    print (xaverage)
    

    結果は以下のとおり

    2.0

    中心化を行う

    単回帰分析の場合、求めるのは

    • 傾き
    • 切片

    の2つ。
    この中心化を行うことで切片を計算する事が不要になる。

    やることは、全てのカラムから、平均分を引くだけ。

    xc = x - x.mean()
    print (xc)

    詳細はこちら  http://www.bokupy.com/detail/93#single-regression3

    結果は以下のとおり

    [-1.  0.  1.]
    [1 2 3]から全てのカラムが平均2が引かれている事がわかる。
  • pip is configured with locations that require TLS/SSL, however the ssl module in Python is not available.

    pip is configured with locations that require TLS/SSL, however the ssl module in Python is not available.

    はじめに Introduction

    macでpip installを行った際、以下のようなエラーが出てinstallができなかった。

    When pip install was performed on mac, the following error occurred and installation failed.


    $ pip3 install numpy
    pip is configured with locations that require TLS/SSL, however the ssl module in Python is not available.
    Collecting numpy
      Retrying (Retry(total=4, connect=None, read=None, redirect=None, status=None)) after connection broken by 'SSLError("Can't connect to HTTPS URL because the SSL module is not available.")': /simple/numpy/
      Retrying (Retry(total=3, connect=None, read=None, redirect=None, status=None)) after connection broken by 'SSLError("Can't connect to HTTPS URL because the SSL module is not available.")': /simple/numpy/
      Retrying (Retry(total=2, connect=None, read=None, redirect=None, status=None)) after connection broken by 'SSLError("Can't connect to HTTPS URL because the SSL module is not available.")': /simple/numpy/
      Retrying (Retry(total=1, connect=None, read=None, redirect=None, status=None)) after connection broken by 'SSLError("Can't connect to HTTPS URL because the SSL module is not available.")': /simple/numpy/
      Retrying (Retry(total=0, connect=None, read=None, redirect=None, status=None)) after connection broken by 'SSLError("Can't connect to HTTPS URL because the SSL module is not available.")': /simple/numpy/
      Could not fetch URL https://pypi.org/simple/numpy/: There was a problem confirming the ssl certificate: HTTPSConnectionPool(host='pypi.org', port=443): Max retries exceeded with url: /simple/numpy/ (Caused by SSLError("Can't connect to HTTPS URL because the SSL module is not available.")) - skipping
      Could not find a version that satisfies the requirement numpy (from versions: )
    No matching distribution found for numpy
    pip is configured with locations that require TLS/SSL, however the ssl module in Python is not available.
    Could not fetch URL https://pypi.org/simple/pip/: There was a problem confirming the ssl certificate: HTTPSConnectionPool(host='pypi.org', port=443): Max retries exceeded with url: /simple/pip/ (Caused by SSLError("Can't connect to HTTPS URL because the SSL module is not available.")) - skipping

    原因 Cause of the problem

    SSL通信ができない?

    Can’t SSL communication?

    対処 countermeasure

    admin権限を持つアカウントで同様のコマンドを実行したところ、無事インストールができた。 おそらく権限周りの問題が根幹にあるようだ。

    When I executed the same command with an account with admin privileges, the installation was successful. Perhaps there is a problem around authority.

  • VMware ESXiにmacからsshする

    VMware ESXiにmacからsshする

    はじめに

    VMware ESXiのホストにログインすることは可能だが、そのログイン方法は少し特殊だ

    ESXiでSSHを有効にする

    デフォルトでESXiはsshが無効になっている。 ESXiシェルとSSHがデフォルトで停止されている。まずはこれを有効にする

    macからESXiへSSHする

    ssh -l user名、 IPで接続する

    ssh -l root 192.168.0.x

    ちなみにシャットダウンは

    poweroff

    コマンドで行う。

  • VPC の作成中にエラーが発生しました: Performing this operation would exceed the limit of 5 NAT gateways

    VPC の作成中にエラーが発生しました: Performing this operation would exceed the limit of 5 NAT gateways

    概要

    VPCを作成する際に出力されたエラー

    原因

    NAT Gatewayの上限に抵触している。

    対処

    上限に達してしまっているので上限を増やす必要がある。

    AWSコンソール上のサポートから問い合わせることで対処が可能

    東京リージョンの「アベイラビリティーゾーン当たりの NAT ゲートウェイ上限数」を10へと変更することによって対応可能。


  • AWS ECRにimageをpushする

    AWS ECRにimageをpushする

    はじめに

    ECRのリポジトリへimageをpushする手順を記載する

    準備

    手元の環境にimageがあること(docker imageコマンドでimageが出てくること)

    $ docker images
    REPOSITORY                        TAG                  IMAGE ID            CREATED             SIZE
    sumito_http                          latest               54f5e642e4ae        5 weeks ago         1.1GB

    手順

    ECRにリポジトリを作成する

    ECRへpush用のタグをつける

    $ docker tag sumito_http 123456789.dkr.ecr.ap-northeast-1.amazonaws.com/dmp/sumito:latest 

    pushする

    docker push 123456789.dkr.ecr.ap-northeast-1.amazonaws.com/dmp/sumito:latest

    この際

    “` no basic auth credentials “`

    と表示される場合はログイン処理が必要になる

    $ aws ecr get-login --no-include-email --region ap-northeast-1

    表示されたコマンドを実施して

    “` Login Succeeded “`

    と表示されればOKだ。

    再度pushするとContainer imageがECRに格納される